Percentage Attendance within Discover
Within Discover it is possible to view the Pupil/Student percentage attendance in a graphical format. To access the Percentage Attendance graph you will need to click on the Attendance option and drag the Percentage Attendance Year To Date report onto the blank canvas.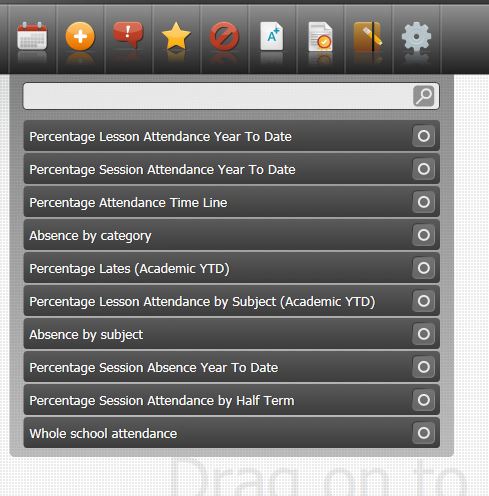
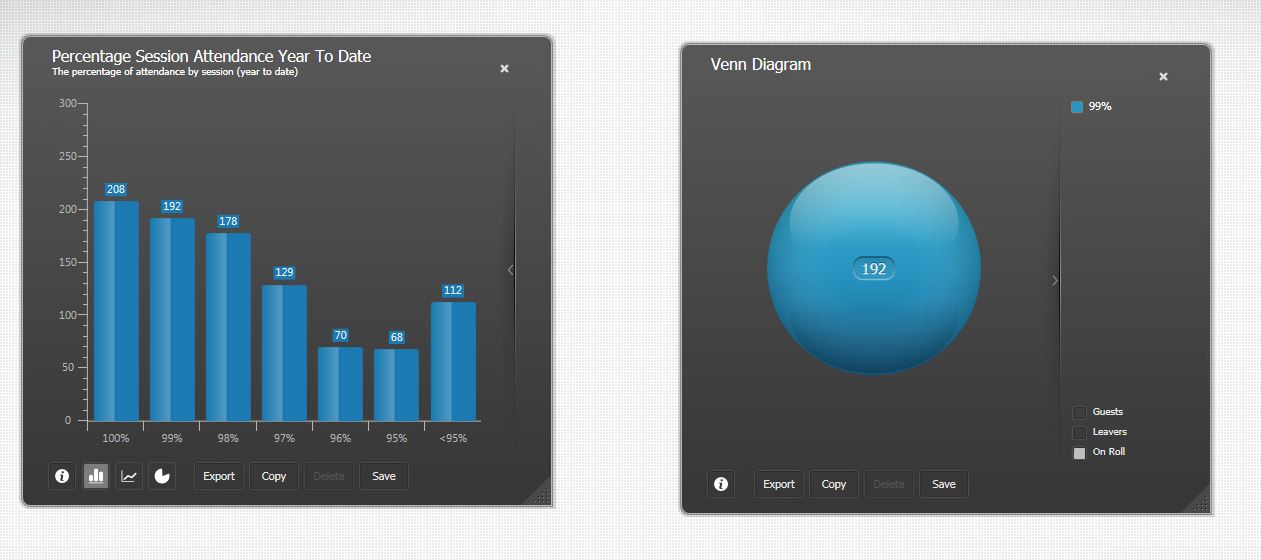
Once dragged onto the canvas the information will be displayed as a bar chart. 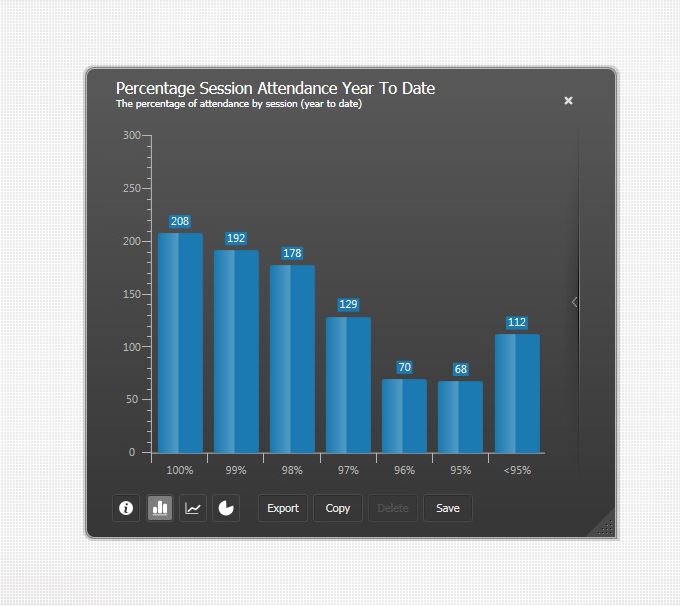
Clicking on an individual bar within the graph will allow you to view the Pupils/Students that are included within that specific data area.
Each graph has a number of options along the bottom. These options will allow you to do the following: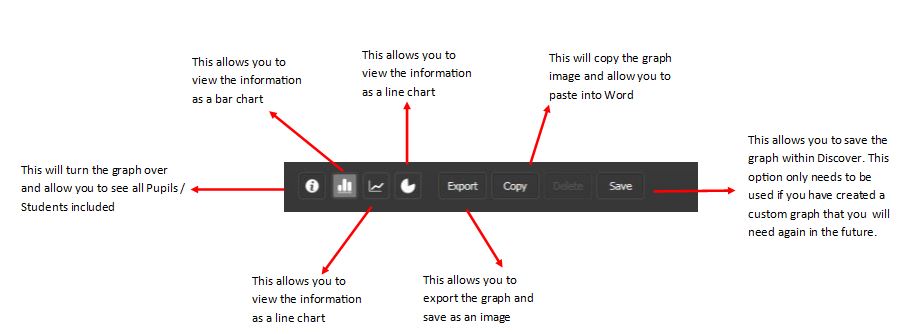
You can also drag one data strand from the graph onto the canvas. This will create a Venn diagram which can then be used to compare with data from other graphs or to create a dynamic group.