What date ranges do the Percentage Lesson/Session Attendance Year to Date Discover graphs use to calculate their figures?
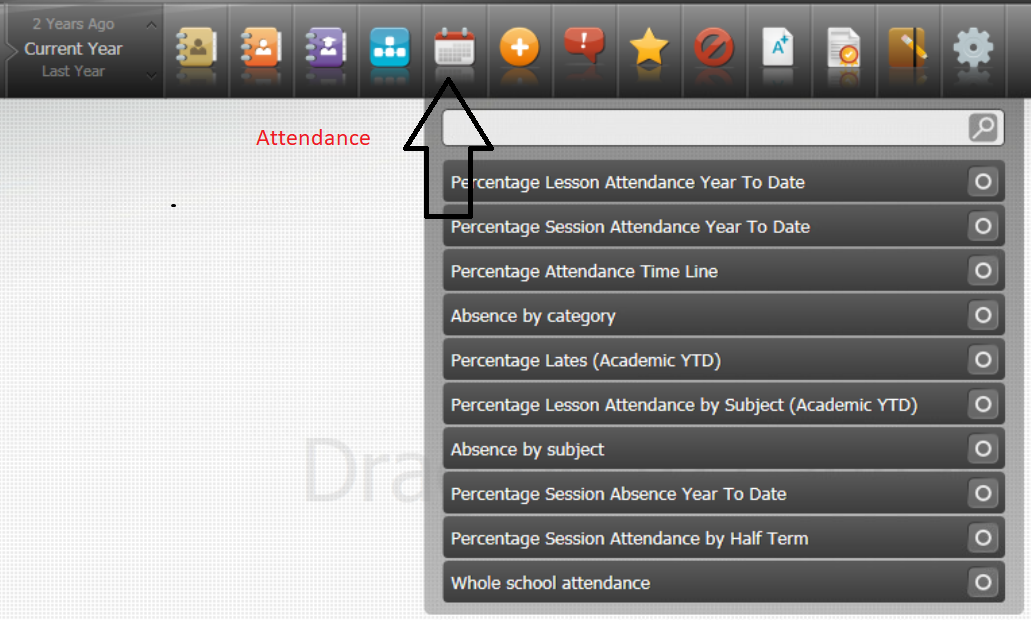
Discover | Percentage Session Attendance Year to Date or Percentage Lesson Attendance Year to Date graphs.
Calculations for the Attendance Year to Date graphs in Discover are made as of the last data transfer, with the default transfer time set to after midnight unless it is manually run or the transfer schedule changed.
This means that the Attendance Year to Date graphs will effectively calculate from the start of the academic year to the time of the last data transfer.